Search This Blog

Saturday, August 22, 2020

The DISplaced...

India's document on climate change, notes how rain-fed agriculture covers 60% of the country’s net sown area, with 40% of the total food production affected by frequent droughts, floods, climate variability and extreme weather. 

Research reveals that the tidal flood water level has risen by a metre between 2004 and 2009 and continues to rise.

In India, close to 1.5 million people are classified as internally displaced every year, many for climate change reasons. At 2.7 million people, India had the highest number of people displaced by disasters and extreme weather events in 2018. 

For example, when cyclone Phailin ravaged the coastal state of Orissa in 2013, the state witnessed an unprecedented scale of migration of fishing communities that had otherwise been based there for decades. 

Even six years after cyclone Phailin, subsidies promised to replace fishing boats and nets lost in the disaster had not been disbursed. 

Researchers in the state of Assam in India and in Bangladesh have estimated that around a million people have been rendered homeless due to erosion in the Brahmaputra river basin over the last three decades. The figure can potentially go up to six million people.

Feb 2020 report : In the last two years, India has been hit by at least one extreme weather event every month. India recorded just 9 out of 93 disasters in Asia in 2019, but accounted for nearly 48% of the deaths.

27 of the 37 states and union territories in India are disaster-prone. 

A recent study in the Proceedings of National Academies of Sciences, co-related 50 years of annual temperature data with the GDP of 165 nations. The study found that India’s GDP is 30% lower today, than it would have been had it not been affected by climate change


The reasons behind these negative impacts are mainly due to decreased productivity and losses due to climate-induced disasters.

In 2018, of the total new 28 million internally displaced people in 148 countries, 61 per cent were due to disasters. In comparison, 39 per cent were due to conflict and violence. 

More countries reported displacement due to disaster than conflict and violence: 144 for disaster and 55 for conflict and violence. 

According to UN, disasters and geophysical hazards have an average of 3.1 million displacements per year since 2008. 

In December 2019, the World Meteorological Organization released the annual State of Global Climate 2019. According to this report, 22 million people would be displaced by December 31, 2019, due to extreme weather events. 

According to the report, more than 10 million people were displaced internally — within a country — between January and June 2019. Out of this, 7 million were due to extreme weather events like floods, cyclones and hurricanes. 

Everyone knows that climate change is displacing people, but no government is willing to acknowledge this officially, for fear of having to recognize these people as refugees and be held responsible for their welfare.

The Highest Temperatures on Earth

In 2010, the most-common value of near-surface air temperature was near 25 °C and a thin tail reached to 50 °C (albeit with very few points above 40 °C). Confirmed temperatures over 50 C had not occurred till then. 

Only five days ago, one of the top-three highest temperatures ever measured on the planet at any time has been recorded at California - 54.4 C. Some climatologists consider 53.88 C readings recorded in California on June 30, 2013, and in Kuwait and Pakistan in 2016 and 2017, respectively, as the highest ever reliably measured on the planet.

A study projects that if greenhouse gas emissions continue at a high rate, temperatures in parts of northeastern India and most of Bangladesh will exceed a deadly threshold during seasonal heat waves. Extreme heat waves that now happen once every 25 years will become annual events with temperatures close to the threshold for several weeks each year, which could lead to famine and mass migration.

Explaining 'Wet-Bulb' Temperatures

What Are 'Wet-Bulb' Temperatures

Wet bulb temperature is a combination of temperature and humidity. There are limits to what wet bulb temperature the human body can survive beyond a few hours, absent airconditioning.

The 1st chart has temperatures on top in C. and Humidity on Left. The intersection of both shows the applicable wet-bulb temperature. 

The second chart shows how to interpret the colours of the wet-bulb temperature squares in the first chart. Concern really begins at Red and then Black squares

When the wet-bulb temp is in Red, one should not work for more than 30 min at a time (followed by rest for 30 min), and one should be having one litre of water for every such work hour. Even these guidelines are for fit hikers, and the rest of us ordinary folks should work even less I suppose. 

When the wet-bulb square is black, one is not suppose to work at all outside of airconditioning.

What Did This Imply in say Delhi, in June, 2018 ?

What does this imply for Delhi wet-bulb temperatures, say in June ? The science says, no work should be done in day light hours, at all outside of airconditioning in June ! Here are four sample June days where i studied the hourly temperatures :

# On June 1st, 2018, for example, one could have done restricted work from midnight-7.30 AM, and 8 PM to midnight ! but no work in day time as it would fall into black wet-bulb squares.

# On 8th Jun, one could have done unrestricted worked midnight to 6 AM.  No work till midnight after that !

# On 15th June, no work outside of airconditioning over 24 hours !

# On 22nd June, only midnight to 6 AM was within safe wet bulb temperature. All the rest of the hours were in black, that is no one was supposed to do any work outside of airconditioning !

Health Impacts of Great Heat and Humidity

A healthy internal body temperature falls within a narrow window. The average person has a baseline temperature between 98°F (37°C) and 100°F (37.8°C). If your body temperature rises as high as 107.6°F (42 °C), you can suffer brain damage or even death. 

Just 5 degrees C deviation of temperature from the usual can have severe health consequences in the human body. 

If your body needs to cool down, these mechanisms include:

 #   Sweating: Your sweat glands release sweat, which cools your skin as it evaporates. This helps lower your internal temperature.
 #   Vasodilatation: The blood vessels under your skin get wider. This increases blood flow to your skin where it is cooler — away from your warm inner body. This lets your body release heat through heat radiation.

This makes the heart beat faster and pump harder. On a hot day, it may circulate two to four times as much blood each minute as it does on a cool day.

Sweat pulls more than heat from the body—it also pulls out sodium, potassium, and other minerals needed for muscle contractions, nerve transmissions, and water balance. Most healthy people tolerate these changes without missing a beat. People with damaged or weakened hearts, have a much harder time, and may succumb to heat stroke.

What do Wet-Bulb Temperatures do to Humans ?


Distance runners were asked to run at speed for 60 min at 31 C temperature at 5 levels of humidity : 23, 43, 52, 61 and 71% (on separate days for each varying level of humidity I presume). 

Immediately thereafter, participants continued running at the same velocity while the treadmill gradient was elevated by 2% every 2 min until volitional exhaustion.

The ability to regulate body temperature during running exercise at 31°C ambient temperature was progressively compromised as humidity increased, and became substantially so when humidity exceeded 60%.

There was a non-linear increase in core temperature and skin temperature during the exercise taken when humidity was at 61 % and at 71 %.

Evaporation of sweat from the skin halved as humidity levels increased from 23 to 71 %.

The study showed that evaporative heat loss plays a vital role as the main avenue for heat dissipation during exercise in the a heat-stress environment.

Heat Stress Imposes a Robust Upper Limit to Adaptation by Humans

A pioneering study published in 2010 had shown that heat stress imposes a robust upper limit to adaptation by humans to gloabl warming.

Peak heat stress, quantified by the wet-bulb temperature TW, is surprisingly similar across diverse climates today (the reference is to 2010). TW never exceeds 31 °C. Any exceedence of 35 °C for extended periods should induce hyperthermia in humans and other mammals, as dissipation of metabolic heat becomes impossible. While this never happens now, it would begin to occur with higher levels of global warming.

Humans maintain a core body temperature near 37 °C that varies slightly among individuals but does not adapt to local climate. Human skin temperature is strongly regulated at 35 °C or below under normal conditions, because the skin must be cooler than body core in order for metabolic heat to be conducted to the skin.

Sustained skin temperatures above 35 °C imply elevated core body temperatures (hyperthermia), which reach lethal values (42–43 °C) for skin temperatures of 37–38 °C even for acclimated and fit individuals.

Friday, August 21, 2020

India’s clean energy prospects

The optimism in the private sector about India’s clean energy prospects a couple of years ago is hard to find now.

Rating agency CRISIL in a recent report said India would not have 100 GW of solar capacity and 60 GW of wind capacity even by 2024, leave alone 2022.

Unfortunately, wind and solar energy developers are running into some of the same problems as their counterparts in thermal power a few years ago, chief among them being outstanding dues from utilities.


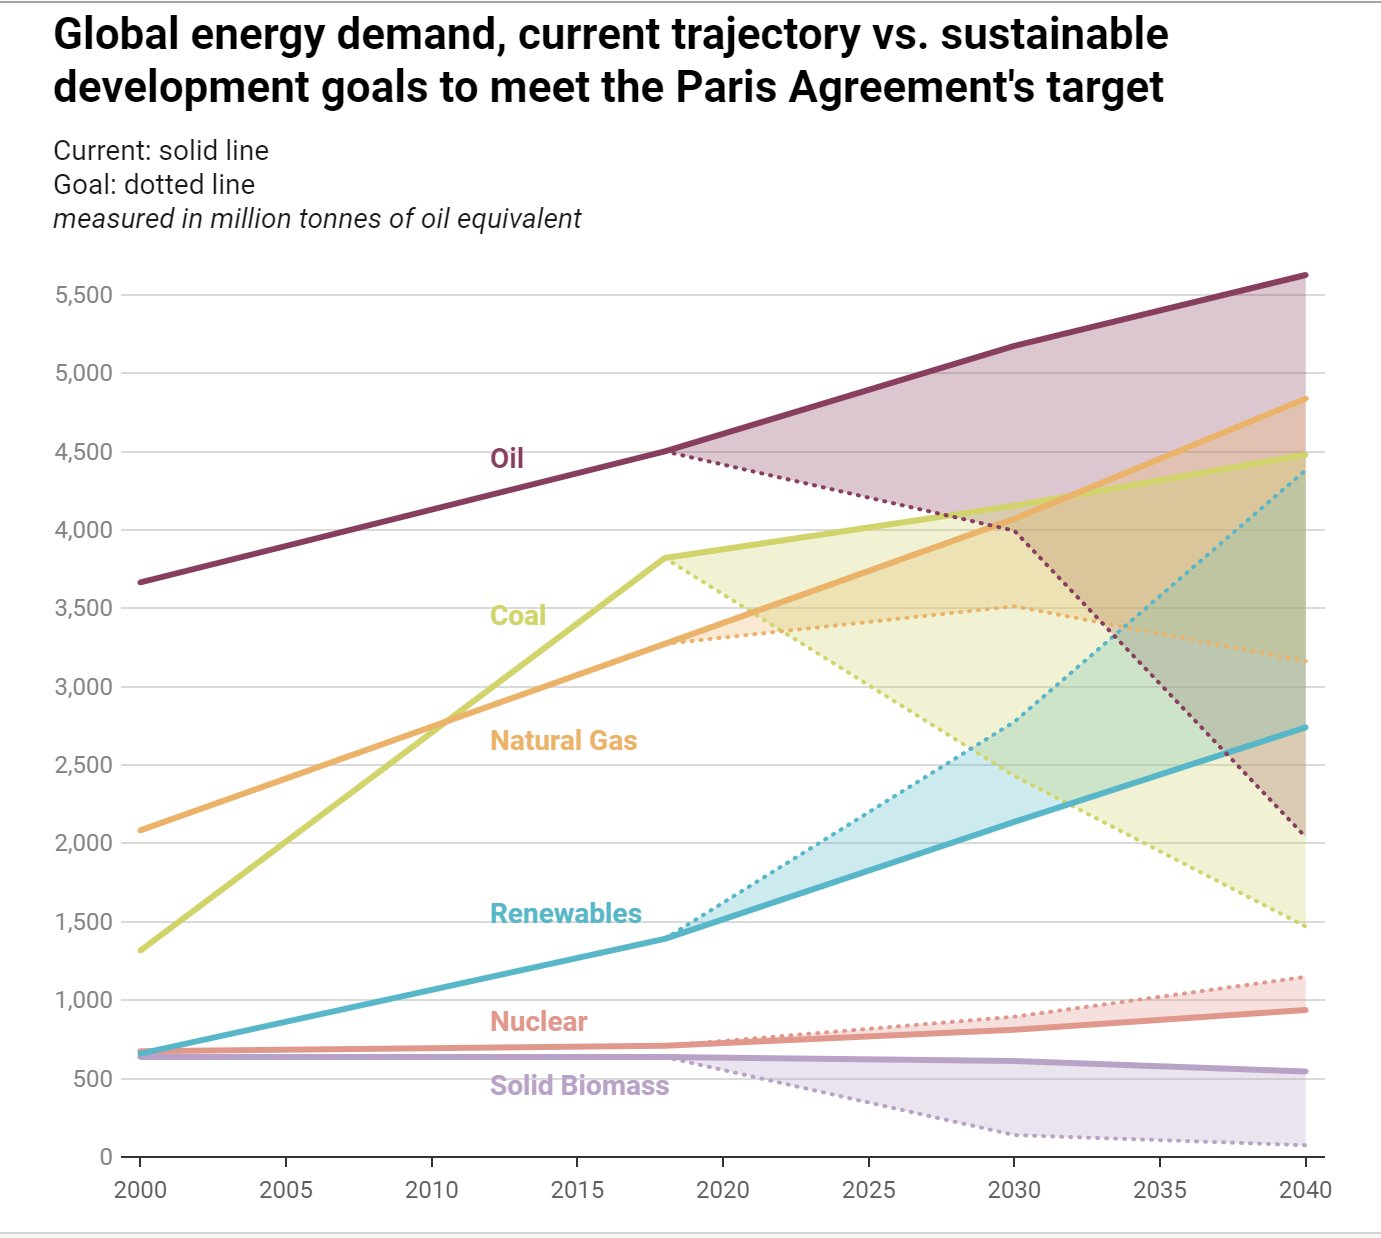
To meet the international Paris Agreement commitments, the world was to have started to sharply decelerate it use of oil and coal in 2018. But that has not happened.

As of July 2019, distribution companies across India owed renewable power producers Rs 9,736 crore, according to CEA data. Around three-quarters of that were owed by four southern states — Andhra Pradesh, Tamil Nadu, Telangana and Karnataka.

Acme Solar Holdings, the country’s largest solar power developer, is waiting for payments totalling Rs 210 crore from Andhra and Rs 386 crore from Telangana. Payments have been delayed between three months and a year.

“We only factor in a delay of 1-2 months,” says Shashi Shekhar, vice-chairman of Acme, “There is a significant loss in return on capital because of these long delays.”

Solar power developers are yet to be compensated for the goods and services tax and safeguard duty on imported cells and modules they paid on projects they won before either of the taxes came into effect.

The CERC has ruled in separate cases that these amount to a change in law and developers have to be compensated for the payments. But companies say they do not know when they will be reimbursed, either as a one-time payment or in the form of increased tariffs.

“I don’t know if some other duty will be imposed tom,” says Acme’s Shekhar. Acme has around Rs 800 C stuck in GST and safeguard duty payments. Because of its liquidity constraints, Acme, which has a portfolio of 5.5 GW, has not bid for any new projects in the past 7 months.
If no solution is found to clear the dues from utilities or on the proposed revision of tariffs in Andhra, in addition to making land acquisition easier and easing tariff caps, global investors is likely to look for opportunities in other economies.

That could lead to a consolidation in the industry, and banks and non-banking financial companies will further tighten their purse strings. Then, India’s bold clean energy targets will remain just that.

A May 2020 report said that with no domestic module and cell manufacturing capacity getting added in the renewables sector during the year, the supply of components from China will be critical.

There’s a widening gap between what the research says needs to be done to curb carbon emissions, and what is actually happening. For instance, demand for electric vehicles is growing but so, too, is demand for much larger and much less energy efficient SUVs.

The number of SUVs on the road around the world increased from 35 million in 2010 to over 200 million in 2018, representing 60% of the increase in the global car fleet over the 8-year period, the IEA said.

As the world tries to cut back on carbon emissions, rising temperatures and erratic weather patterns haven’t made it easy. IEA estimated that nearly one-fifth of 2018′s energy demand growth stemmed from hotter summers and colder winters.

Tuesday, August 18, 2020

Some Corporates in India are Moving towards Renewable Energy

Corporate (industrial and commercial sector) electricity demand accounts for about 50% of total electricity consumption in India and globally. 

Infosys, Dalmia Cement, Mahindra Holidays & Resorts and Tata Motors – are Indian-headquartered companies that have voluntarily adopted 100% renewable electricity consumption targets. 

Additionally, there are more than 40 international companies that have India presence and are moving their operations to renewable energy.

A leading company representative said in May 2020 that the prime hurdle for achieving full renewable energy for their company was the volatile policy and regulatory framework.

Companies leading the transition towards 100% renewable energy have asked to be rewarded, possibly through special policy incentives.

Solar Power in India Since 2014

By Feb 2020, India had installed 35 GW of solar power generation capacity. Solar power tariffs in India are among the lowest in the world.

As of 2019, a third of the world’s total installed solar capacity was in China, and 7 % in India.

The NDA government chose a strategy that prioritised retaining a low minimum tariff on projects while increasing protection against imported panels, thereby forcing developers to buy panels at a higher cost. Since then, bidding processes have slowed down, highlighting the incompatibility of these goals. 

In Jul 2020 Modi said that as part of Atma Nirbhar Bharat, the country’s aim is to end its dependence on import of all equipment, including solar panels.

International experts said in March 2020 that India has seen too much policy inconsistency and change, as well as state-centre conflicts, plus the drag of national policy objective contradictions to be on track to achieve the goal of creating 175 GW renewables capacity by 2020.

The history of Solar Power in India till 2014


Indian renewable energy development agency was formed in 1987 to operate a revolving fund for developing, promoting and commercialization of New and Renewable Sources of Energy.

From the late 90s, Independent Renewable Power Producers were given the right to wheel the (renewable) power through existing transmission lines of the State Electricity Boards on payment of reasonable charges for selling the power to any third party in the country. 

Upgradation of technology for solar photovoltaic cells was undertaken.

By 2007, 3000 villages were electrified using solar technologies. There were 2000 solar power plants in operation, and over 6 lakh solar lanterns / 3 lakhs home lighting systems in use. Over 60,000 street lighting systems were in operation.

Government of India launched Jawaharlal Nehru National Solar Mission in 2010, as one of its eight missions under National Action Plan on Climate Change. It was believed that solar power can be important in attaining energy independence. 

As of April 2014, India's total installed capacity through grid connected solar power plants had crossed 2.2 GW.

In SIX Years, NDA Managed to Increase Electricity Generation from Renewables only by 3.5+ %

I have been reading about solar power in India again – last I read in-depth was I think in 2017. I found then that the rosy headlines were far from the reality of many stumbling blocks on the way of serious renewable power adoption in India.

In today’s reading also, I found a great distance between the reality and headlines. What matters is NOT installed capacity (large portions of which may never be used and which become net contributors to climate change because of the CO2 generated in constructing them), but the electricity generation mix.

After all the sound and fury of the last six years, in 2019-‘20, India generated nearly 10 % of its electricity using wind-power, solar, biomass and mini-hydro.

In SIX years of constant soundbites, the improvement in electricity generation mix in favour of renewables was only a little over 3.5 % - in 2014 it was 6.38 % of the total electricity generated, and in 2020 it was 9.99 %.

The UPA government had achieved similar improvements in electricity generated from renewables in the 5 years before demitting power to NDA : from 3.76 % of the electricity generation from renewables to 6.38 % - that is a little over 2.61 %.

In fact, in the 5 years after taking power, NDA had a similar performance : It improved the electricity generation in favour of renewables from 6.38 % to 9.24 % : nearly 2.86 %.

So the NDA government at best takes the work of the UPA government forward in its logical trajectory. It makes a whole lot of noise to show astronomical achievements which are never there on the ground when I check. Besides, it does enormous damage in other areas of life in India.

Tourism's Impact on the Environment and Local Communities

I have begun to read on tourism's impact on the environment and local communities. Found these beginning steps in the context of tourism in the USA, but applicable anywhere.. atleast these need to be part of the ethos of all travellers anywhere. 

The Audubon Society has recognized the potential for adverse effects of tourism, and has developed a “Travel Ethic” for tour operators that provide wilderness trips. The Travel Ethic encourages tour operators and cruises to stay on trails to protect vegetation, keep a minimum distance from wildlife, refrain from destruction of coral reefs, maintain and enforce an anti-dumping policy, and educate tourists about the types of souvenirs not to buy (such as sea turtle products and ivory). 


The Sierra Club also educates its members on methods to minimize their impact on the environment. The club’s concern about the potential impact of member travelers on the environment started as early as 1970, when its leaders commissioned a report from three professors about any adverse impacts Sierra outings had, and how they could be mitigated. These “Wilderness Manners” include traveling on durable surfaces, camping away from water bodies and trails, reducing litter by repackaging used food and carrying out all trash and garbage, minimizing use and impact of fires, and respecting wildlife and other travelers. 


The World Wildlife Fund (WWF) uses the trips it sponsors as a way of fulfilling one of the tenets of ecotourism: using tourism to support conservation. The WWF attempts to minimize the environmental impacts of their trips by selecting commercial tour operators according to their reputation as environmentally friendly.


The report speaks of this : Three examples of tourist infrastructure that minimize environmental impact and incorporate local people’s needs are two eco-resorts in the U.S. Virgin Islands, and a riverfront park in Detroit, Michigan. 


Maho Bay Camps and Harmony Resort were built in the 1970s, and are two of the best known and successful eco-resorts. Wooden walkways minimize soil erosion and vegetation damage from trampling. Communal toilets and captured rainwater reduce water usage, and reliance on solar and wind power along with computer monitoring of electricity and water use help reduce energy use. 


The “Detroit Linked Riverfront Parks Plan” is a good example of effective tourism planning. In lieu of indiscriminate development based solely on economics, planners first determined the needs of the local people, and then designed the area accordingly.


Sectors of the tourism industry have the opportunity to “channel” activities of both

tourists and employees toward more environmentally responsible activities. This type of
influence has been termed “downstream” leverage. The lodging industry exerts downstream influence on tourists by encouraging environmentally sound practices. Ramada International Hotels and Resorts distributed 20,000 copies of “50 Simple Things You Can Do to Save the Earth” to guests as a method to encourage environmentally responsible behavior. 

It has been suggested that an effective way to implement changes favorable to the environment is by starting with hotel employees in areas such as laundry, housekeeping, and engineering (Shanklin, et al., 1991, p. 65). These employees have first direct contact with some aspects of the hotel business that have an impact on the environment (such as washing linen and sheets).


There are also efforts in place to minimize water use. 77% of U.S. hotels use low flow shower-heads, and 33% use low consumption toilets. However only 4% of hotels reclaim their laundry wastewater, and 2% use their gray water for irrigation, as of 1990.


Royal Caribbean Cruises is an example of a cruise line using leverage with suppliers to encourage use of products that minimize environmental impact. Through a Quality Supplier Development Program, the cruise line has convinced suppliers to reduce packaging and substitute more environmentally benign materials. In the last five years they have reduced packaging by 35% through several different routes including ordering ketchup and chili sauce in 5-gallon pouches instead of tin cans, ordering some beer in kegs rather than cans, putting fountain syrup in 5-gallon boxed bags, which saves 250,000 syrup cans annually, and purchasing soda in cans without plastic rings.


Decreasing water availability and growing demands due to climate change and increasing tourist numbers in the Mediterranean basin are likely to result in worsening conflicts between socioeconomic sectors that depend on water to survive. In a study, hotel size, category, and year of construction/renovation were all directly associated with the implementation or lack of implementation of certain water-saving measures.

The hoteliers did not perceive any strong incentives to adopt water-saving measures, but there were clear indications of cost and technical barriers and a lack of awareness about possible options.

Hotels with more rooms, more stars, and more services tend to consume more water.

The most widely implemented water-saving measures by the hotels surveyed were low-cost, low-tech, and legally enforceable measures. The main measures were dual-flush toilet systems and improved towel and bed linen reuse policies (both present in 78.9% of hotels) and faucet sensors, timers, or aerators (73.7%).

In regard to hotels with swimming pools, the most common measure was the installation of shower sensors or timers (71%). Of the six hotels with gardens, 4 (66%) had installed more efficient irrigation systems (sprinkler or computerized irrigation systems), and just two (16.7%) had planted native or drought-tolerant plants. None of the hotels had replaced lawns with paving or synthetic grass. The maintenance of natural lawns requires large volumes of water as they are typically composed of non-native grasses.

Overall, just 42.1% of hoteliers stated that their workers received training on water-saving practices, whether in the form of specific programs or informal training by the owners or managers. All the large hotels and some of the medium-sized hotels provided training and the hoteliers were of the opinion that this was crucial for helping to save water and reduce operating costs.

It is noteworthy that 77% of hotel managers stated that all the measures implemented had been effective and had resulted in a real reduction in water consumption.

None of the hotels had introduced systems for gray-water reuse, rainwater harvesting, water consumption monitoring in key areas, or leak detection. All four measures require greater investment and technical knowledge and have a longer payback period.

There was a lack of awareness about water shortage problems and their potential impact on hotels in the future: Almost 60% of those interviewed were of the opinion that their hotel did not have water problems and believed that this would continue to be the case. They were also unaware that the implementation of water-saving and efficiency measures could be both beneficial for the environment and profitable for their business.

Barriers related to marketing and publicity were mentioned by several managers. In particular, faucet flow restrictors, bathtub-to-shower conversions, and towel and bed linen reuse programs were perceived as measures that could lead to a loss of business.

Those interviewed suggested various ideas, including technical training for owners and managers.